
Explore MEL analytics
Use the analytics page to see reach, equity, participation, outcomes and satisfaction.
- 1
Open MEL Analytics
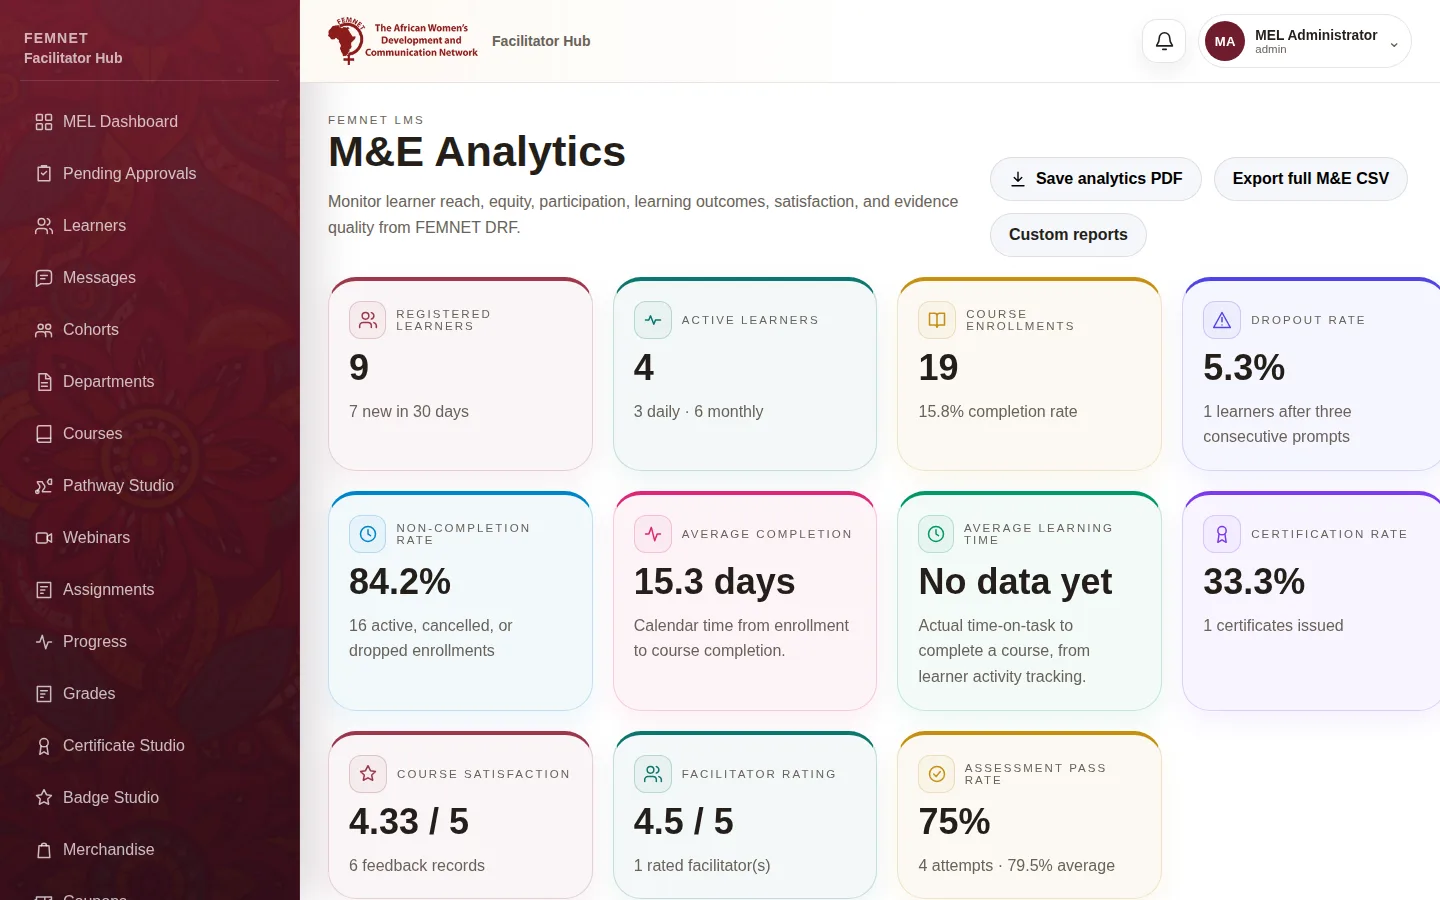
Select MEL Analytics in the hub menu. The page brings together reach, participation, learning outcomes and feedback for the whole portal, or your department if you are a facilitator.
- 2
Reach and growth
The first cards show registered and active learners, enrolments, dropout and completion rates, learning time, certification rate and pass rate. The Registration growth and Enrollment trend charts cover the last 30 days.
- 3
Who you are reaching
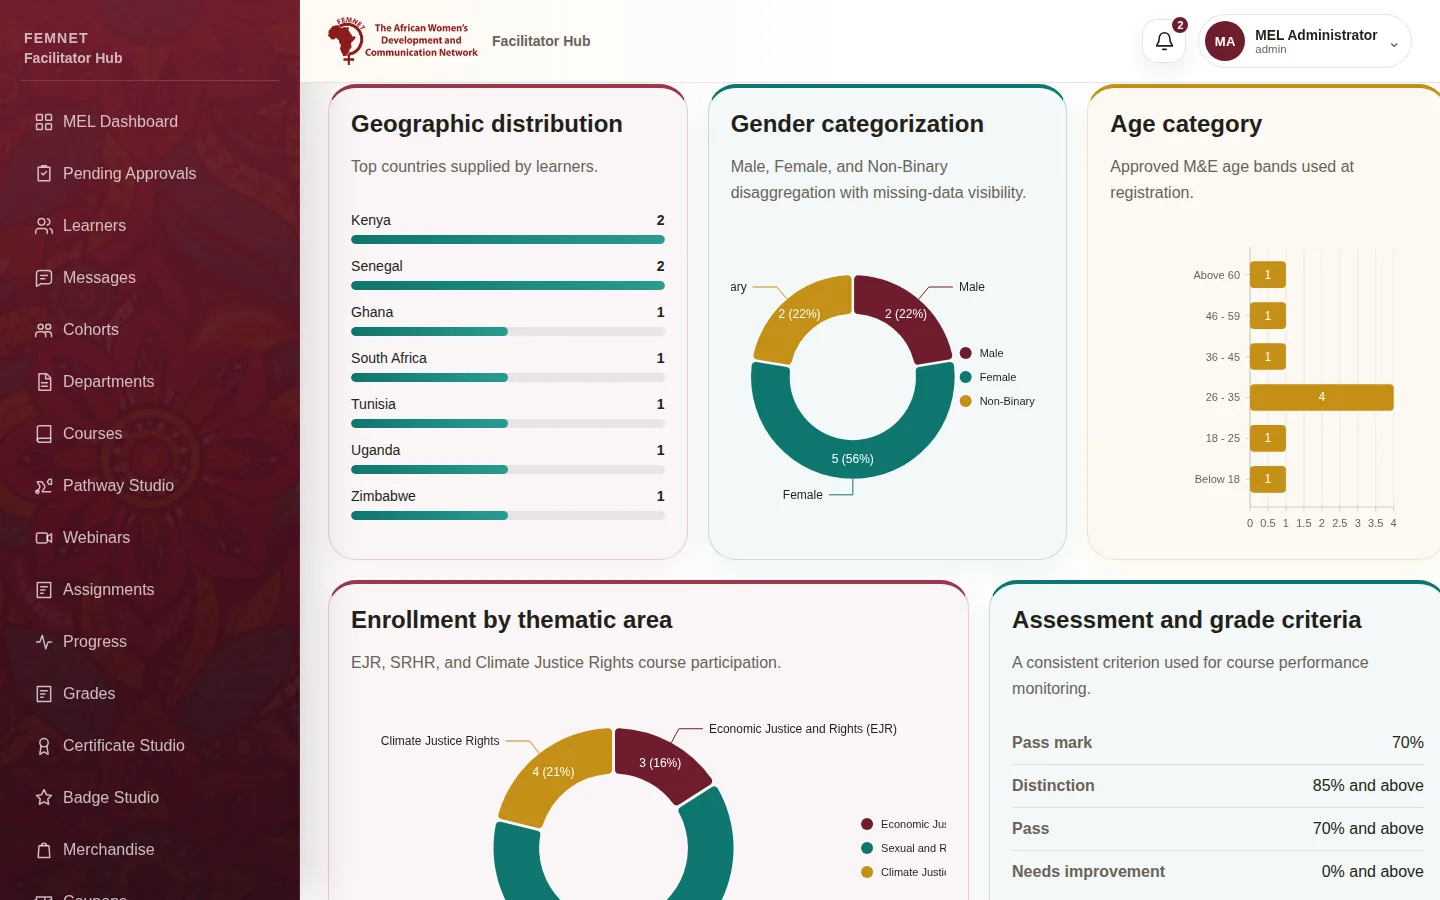
Geographic distribution, Gender categorization, Age category and FEMNET membership break learners down by what they gave at sign-up. How learners heard about FEMNET shows the learners chose after their first sign-in.
- 4
How courses perform
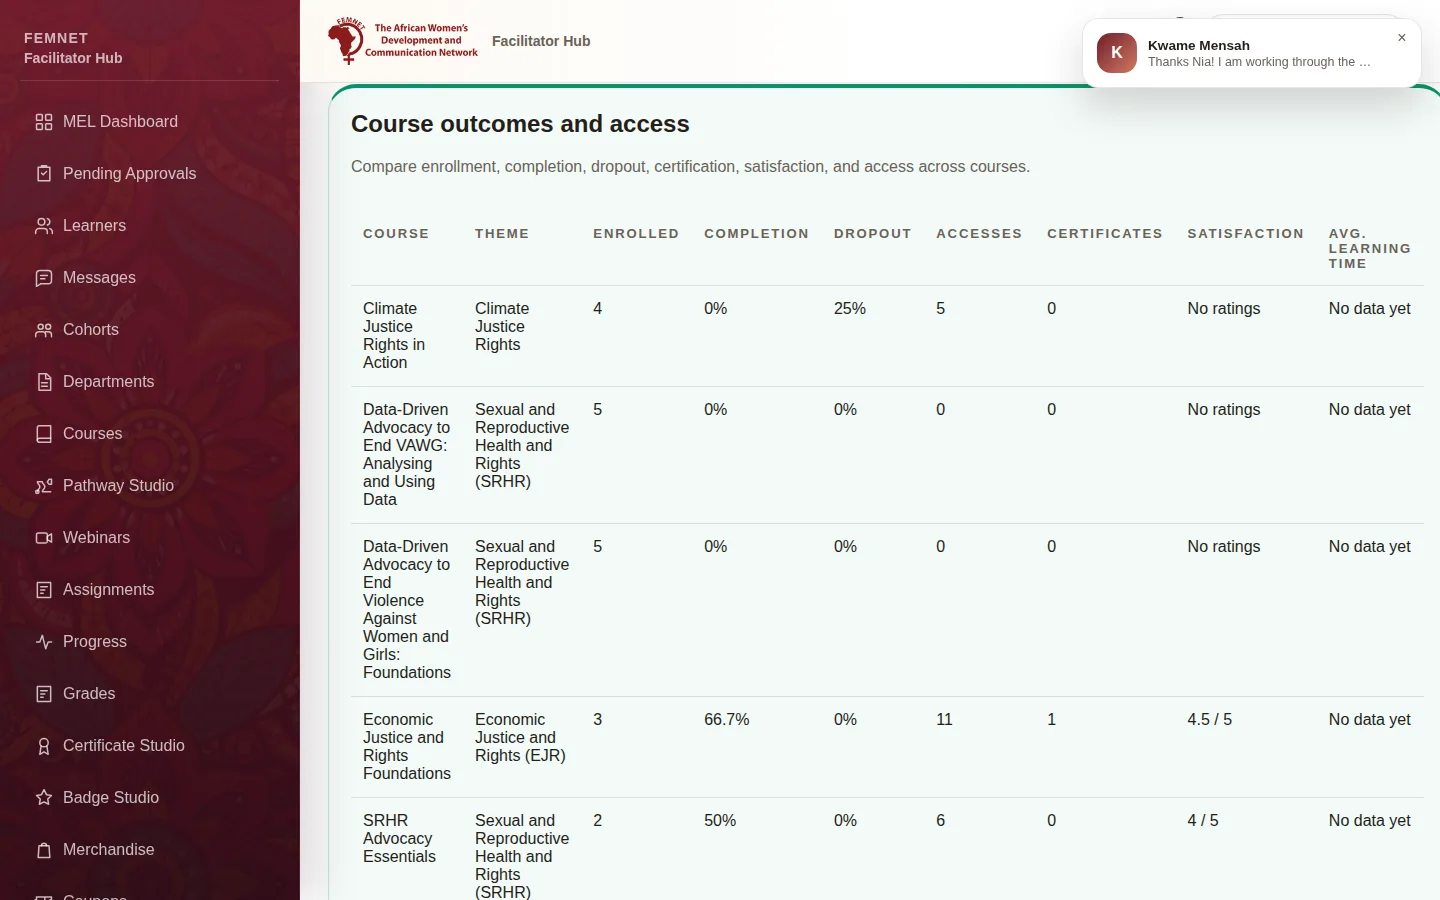
Enrollment by thematic area and Course outcomes and access compare courses by enrolment, completion, dropout, certificates and satisfaction. Most accessed and Least accessed courses show which courses may need promotion.
- 5
What learners think
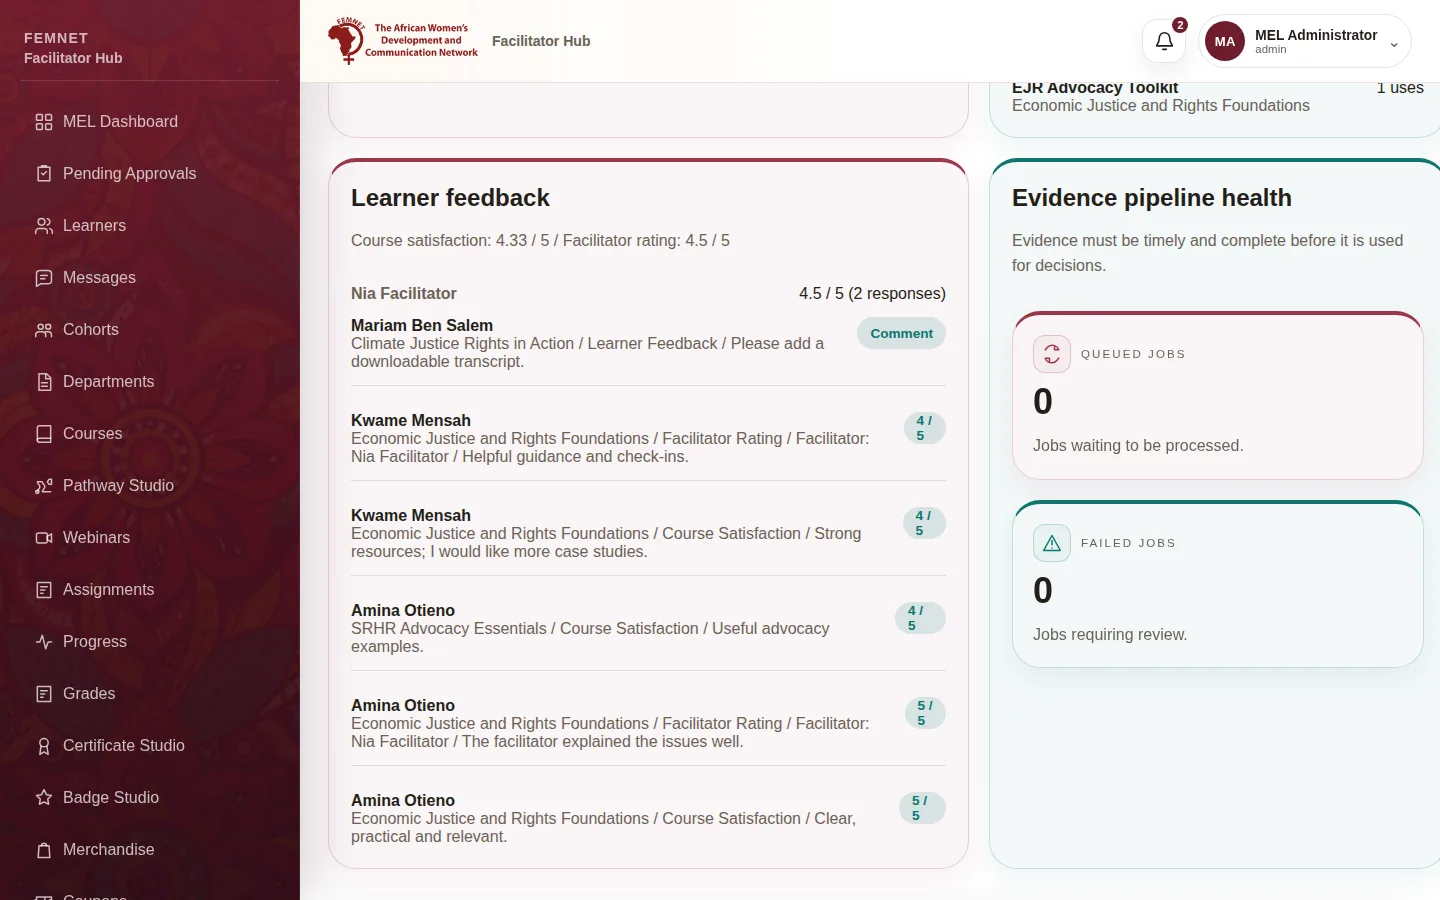
Learner feedback lists course and facilitator ratings that learners leave when they finish a course.
- 6
Export the data
Select Export full M&E CSV to download the underlying data for Excel, or Save analytics PDF for a printable copy.
Step 1: Open MEL Analytics